The Partner Portal is a reporting tool that can help you track the results of referrals you submit, and compensation you receive from Heartland associated with your referrals. You and/or your employees should enter ALL your referrals directly into the Portal. A step‐by‐step tutorial is outlined below.
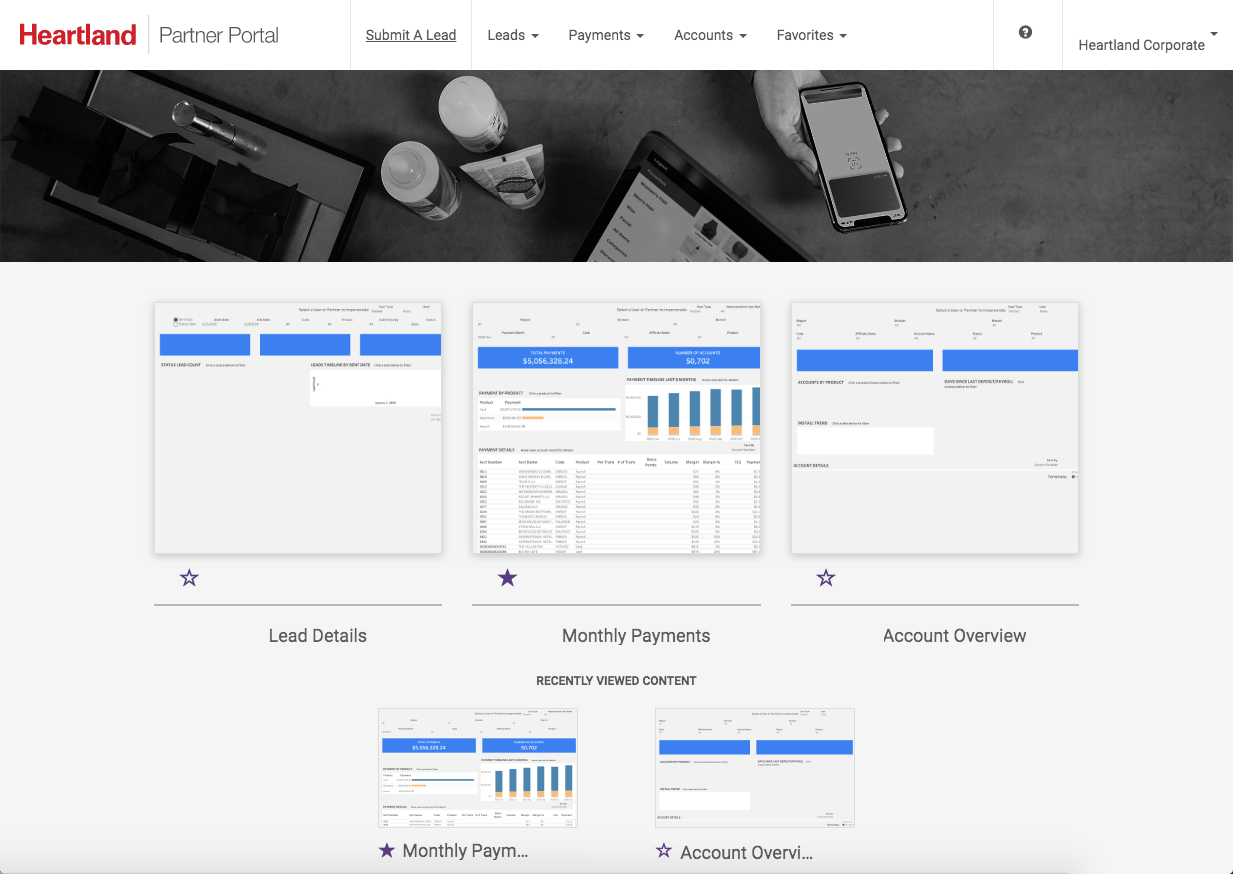
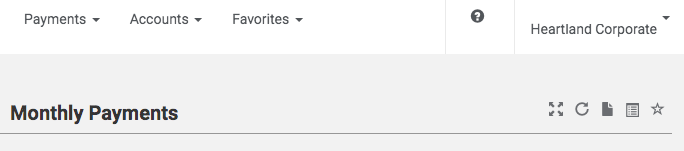
The Partner Portal contains multiple dashboards designed for specific reporting needs. Dashboard navigation can be found across the top of the page. The navigation menu has options for submitting a lead, lead reporting, monthly payments, account reporting, and a favorites menu.
Recently viewed dashboards will be displayed as thumbnails on the landing page as well.
To enter a lead, select “Submit A Lead” in the navigation menu. Your customized lead entry form will be displayed.
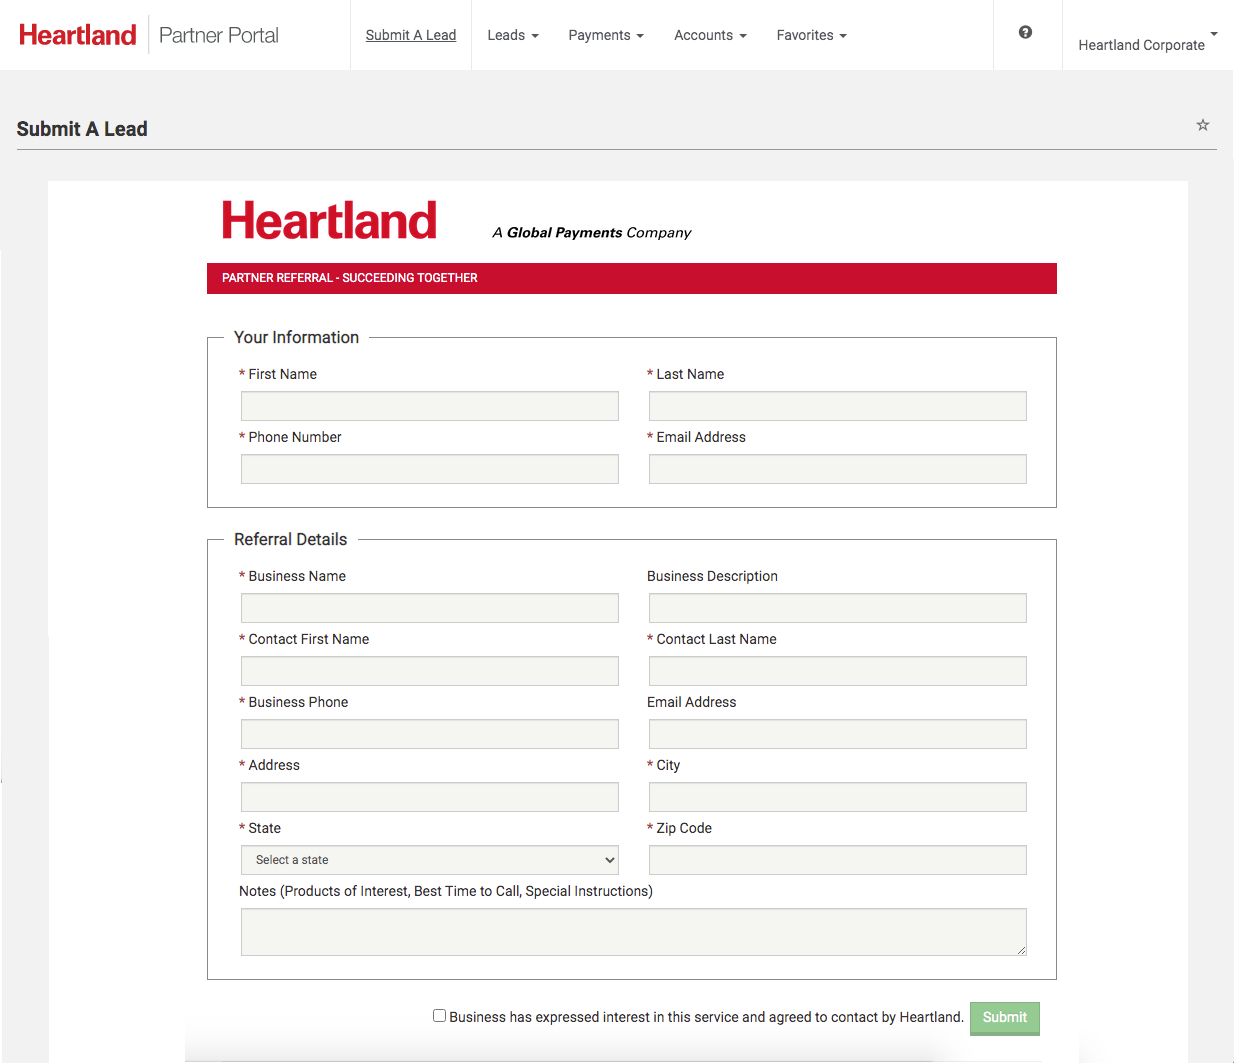
Once submitted, the lead is automatically routed to your salesperson and they will contact the business.
Select “Leads” in the navigation menu and choose a dashboard. Multiple dashboards are available for lead tracking. For example, the “Lead Details Dashboard” is shown here.
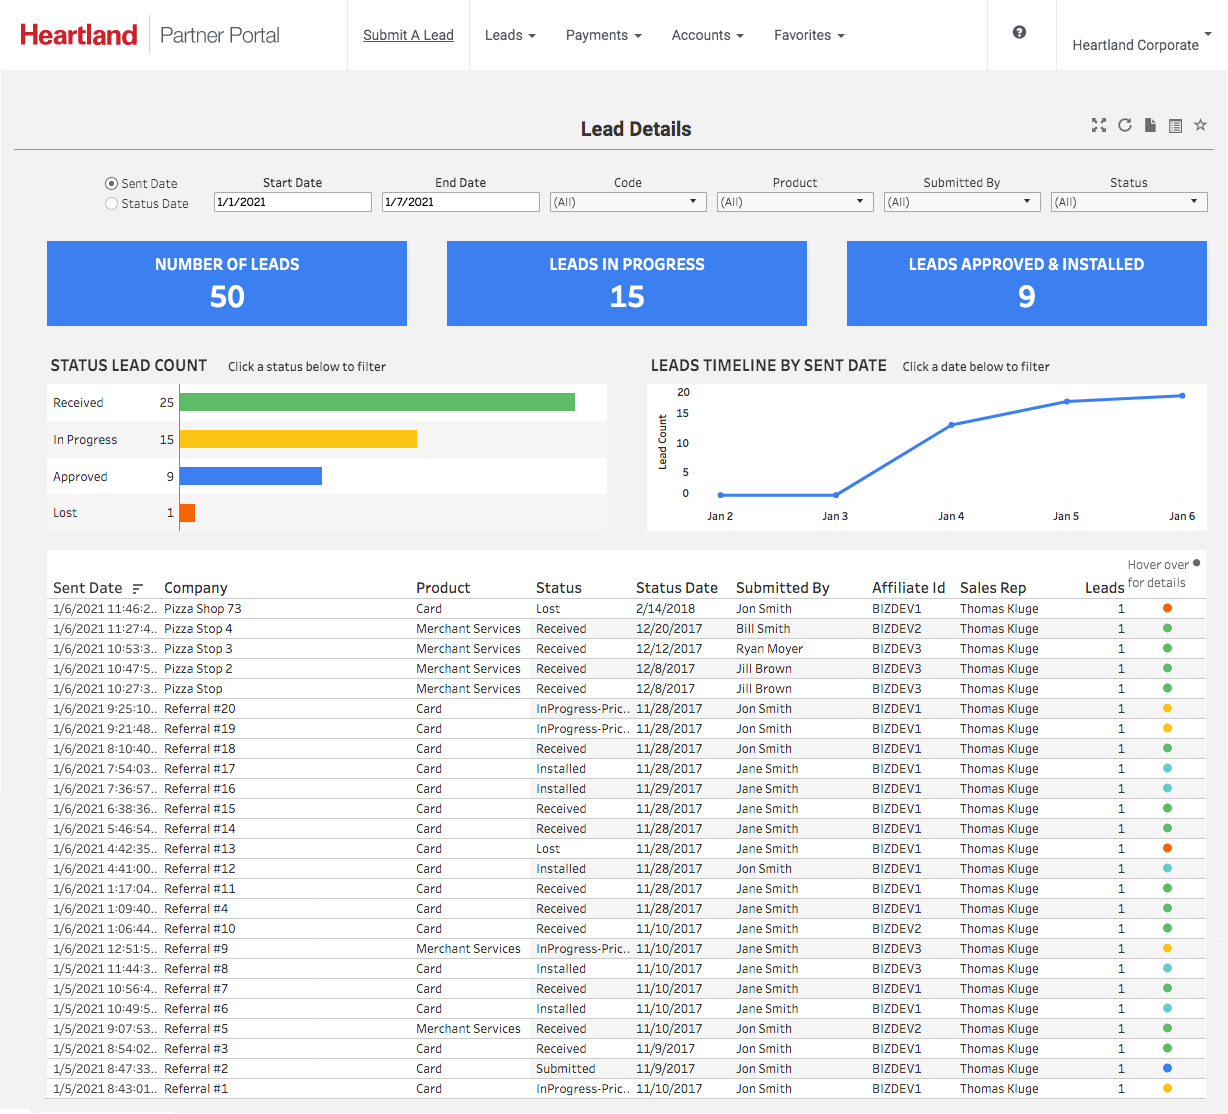
Summary reports are located at the top of the dashboard indicating how many leads have been entered during the selected time frame, how many are in progress and how many are approved/installed. There is also a graph of how many leads are in each status.
The Lead report at the bottom of the page will show the date the lead was entered, the business name, lead product, status of the lead, the effective date of that status, the name of the individual that submitted the lead, what code it is attached to, and the Heartland salesperson working the lead.
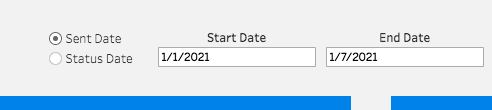
You can view your leads by sent date or status date. Sent date refers to the date which the lead was entered, status date refers to when the status was last updated by the Heartland salesperson.
Select “Payments” in the navigation menu and choose the “Monthly Payments” dashboard.
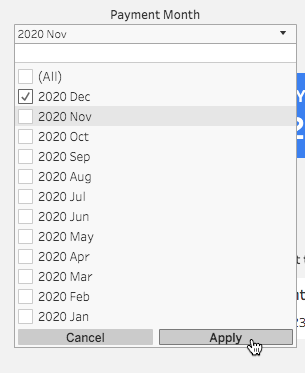
The most recent payment month will be selected by default, but you can use the Payment Month filter to select other payments.
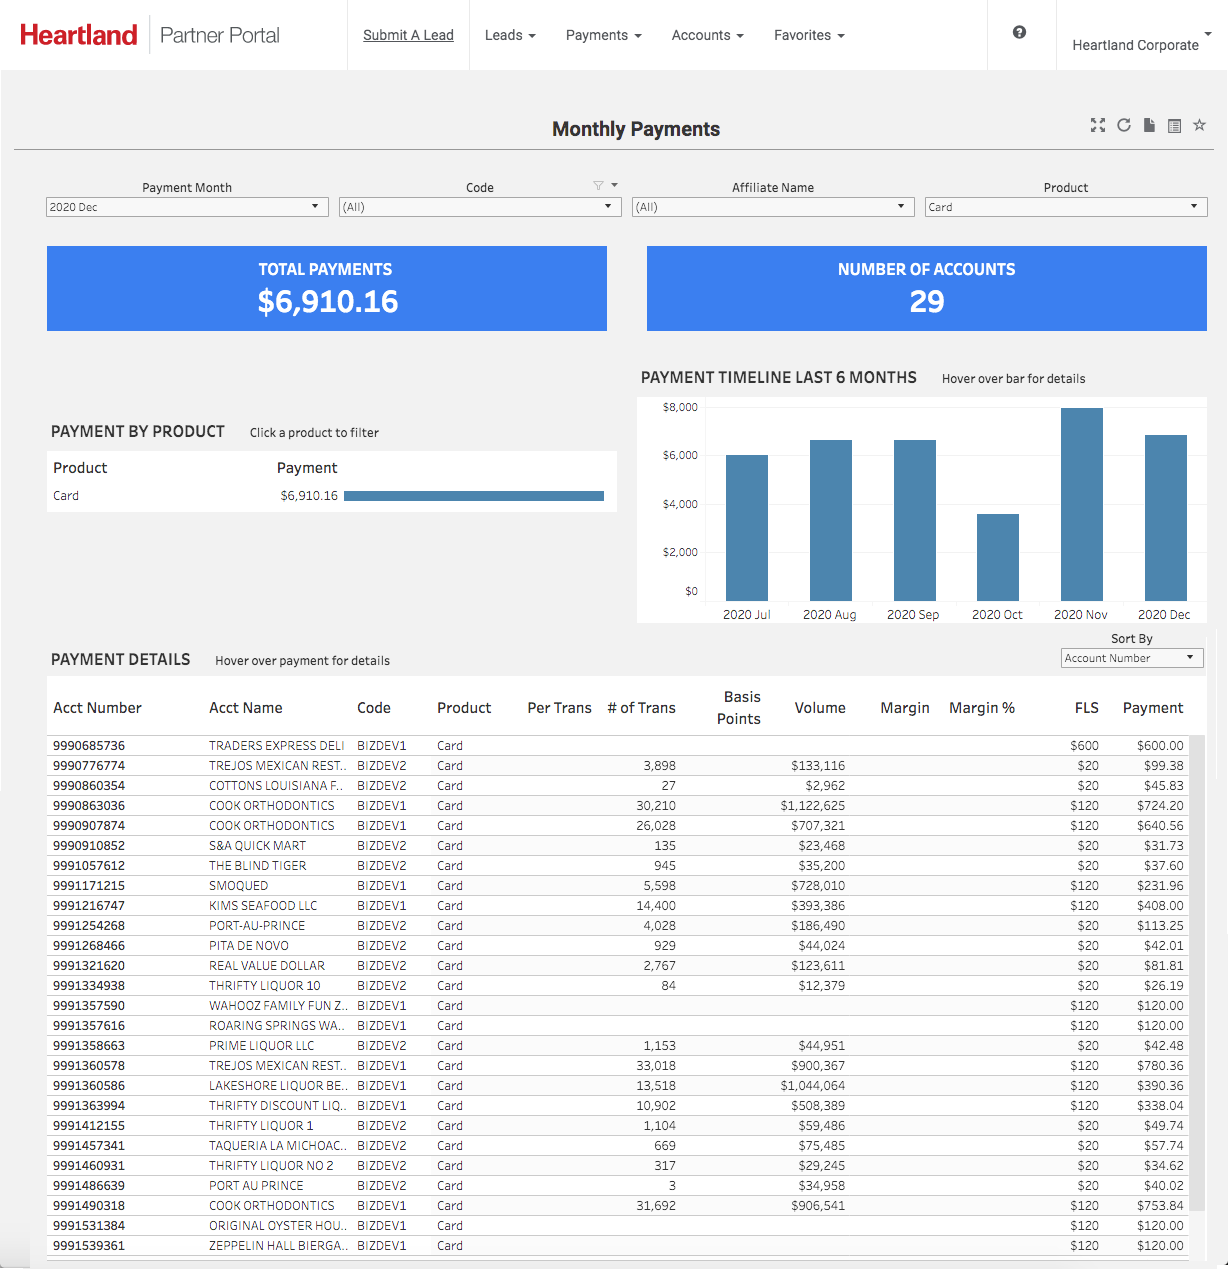
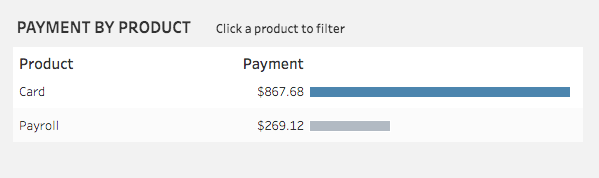
Summary reports are available at the top of the page indicating the total pay amount, number of accounts, payment by product, and a payment graph showing the last 6 months.
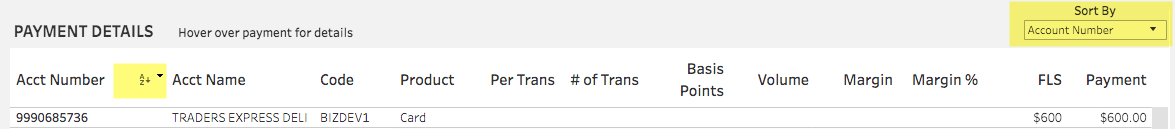
The Payment Details report at the bottom of the page breaks down each merchant and calculation that makes up the payment.
Please note:
The Payment Details report reflects only those merchants that generated a payment for that time period. If a merchant is not on the report, there may not have been activity to generate a payment during that time period. All merchants can be found on the Account Overview dashboard.
Select “Accounts” in the navigation menu and choose the “Account Overview” report.
The Accounts Overview dashboard contains reporting on all accounts installed through our partnership.
The top of the screen will display summary reports showing the number of accounts in each status by product, the number of accounts by activity time frames since their last deposit/payroll, and a graph visualization of install trends.
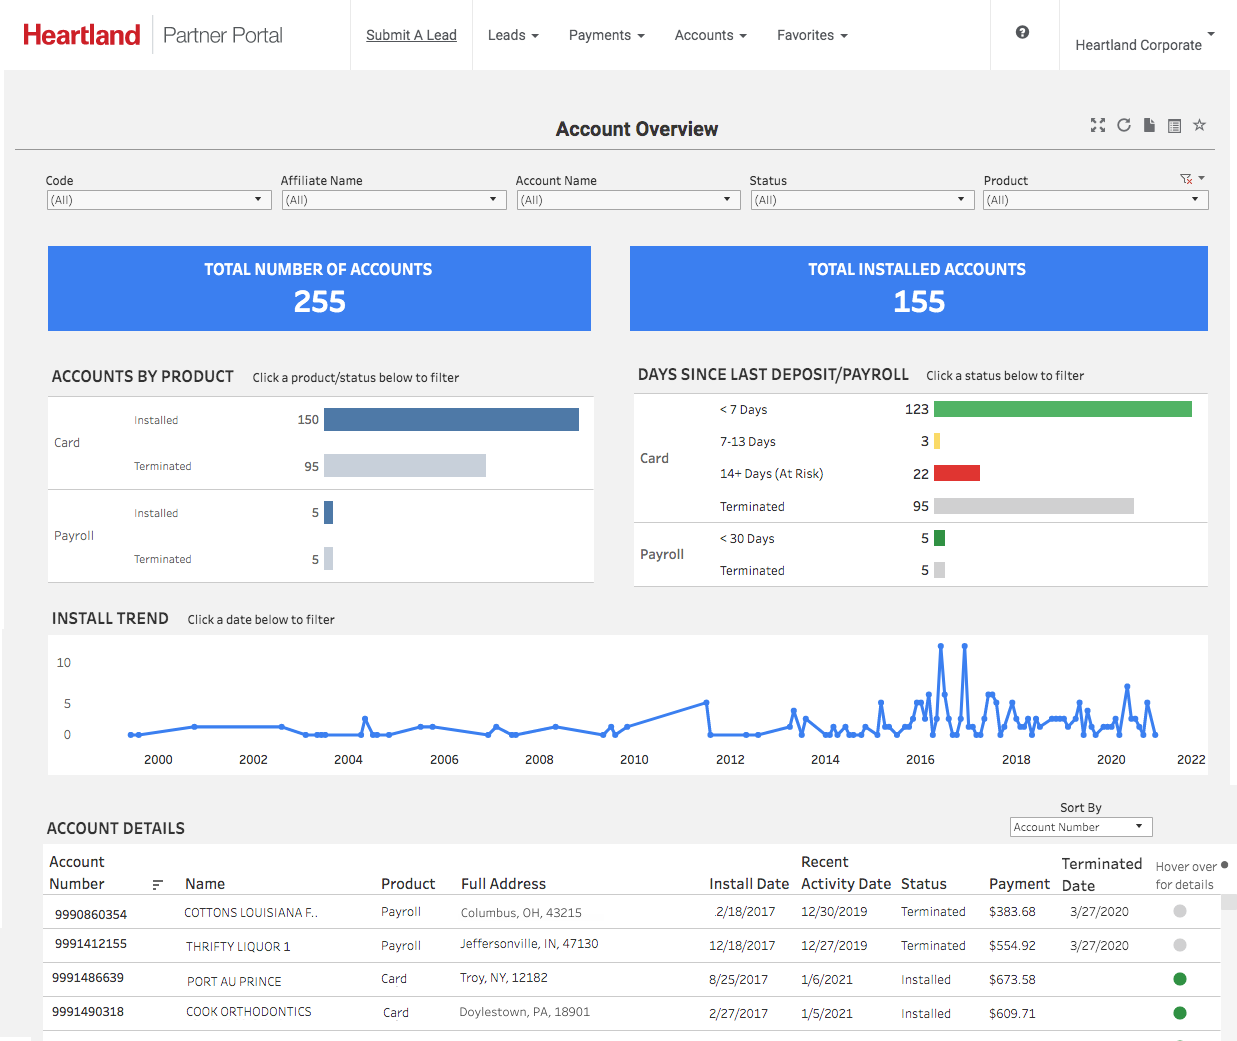
The “Account Details” report at the bottom of the page will break down the list of accounts in all statuses with their status dates and lifetime payment totals.
Filters are available at the top of each dashboard to filter the displayed data. Select the drop down under the filter category and select the time frame or categories you wish to view. Remember to click apply.
Many reports can be used to filter the entire dashboard as well. The report title will indicate you can click to filter. Choose an item by selecting it on the report to filter the entire dashboard. For example, on the “Monthly Payments” dashboard you click on payroll, the dashboard will update to reflect only the data of payroll accounts.
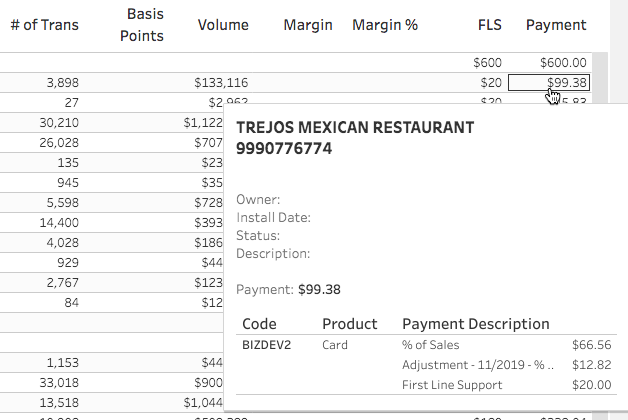
Many reports will display more information when hovering the cursor over a data point. On the detailed reports on the bottom of each page, hover your mouse over the far-right column to drill down for further information:
If a report includes a “Sort by” drop down, you can select a category within that dropdown to sort the report.
You can also sort the detailed reports themselves by clicking on the report, hovering your mouse over the column header you want to sort by and clicking the small icon that appears on the right side.
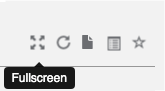
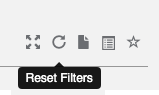
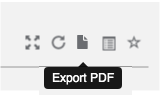
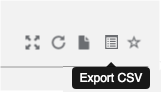
The top right corner contains buttons that allow you to set your view to full screen, reset filters, export to PDF, export to csv, and tag a dashboard as a favorite.
Expand the dashboard to the size of your screen by selecting the fullscreen button.
Reset your page and turn off any applied filters by selecting the “reset filters” dashboard button.
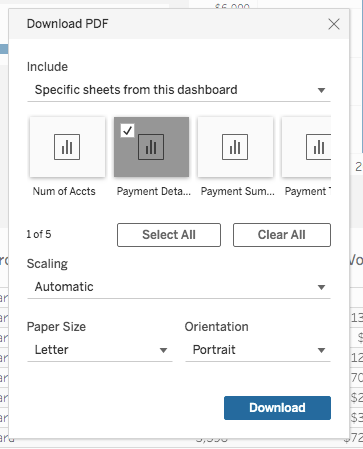
- When selecting “Specific Sheets from this dashboard” a list of the reports will appear, select the title of report(s) you wish to download.
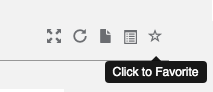
Click the star dashboard button to set a dashboard as your favorite. All of your favorite dashboards will be displayed in the Favorites navigation menu at the top of the screen.
For questions regarding the Partner Portal please email PartnerPortal@heartland.us